KmPlot
Categories: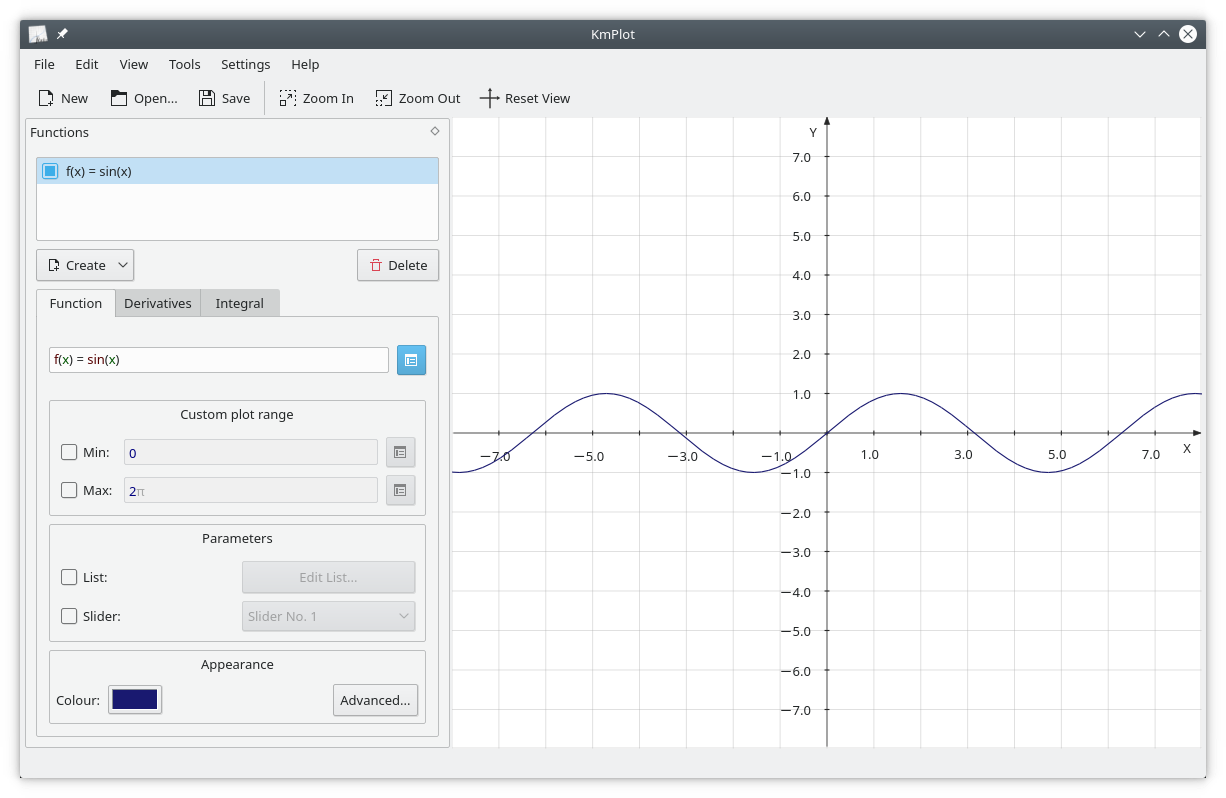
KmPlot is a program to plot graphs of functions, their integrals or derivatives. The graphs can be colorized and the view is highly configurable, is scalable, and can be zoomed. The program features a powerful mathematical parser, different plot types (cartesian, parametric, polar, implicit, differential), and provides simple mathematical tools like for finding maximum/minimum of a function. Parametrized functions can be visualized by adjusting the variable parameter via a slider. Plots can be exported as bitmap format pictures (BMP, PNG) and can be printed.

Install on
Linux


Releases RSS
1.3.24022
2024-04-11
1.3.24021
2024-03-21
1.3.24020
2024-02-28
1.3.23085
2024-02-15